Anti-Racist State Budgets: Progressive Revenue
This primer is part of a series on anti-racist state budgets. To understand the concept of creating anti-racist state budgets, it is important to understand the difference between racist and anti-racist ideas and policies. The following excerpts are from How To Be An Antiracist (2019) by Ibram X. Kendi:
Racist vs. Anti-racist Ideas
A racist idea is any idea that suggests one racial group is inferior or superior to another racial group in any way. Racist ideas argue that the inferiorities and superiorities of racial groups explain racial inequities in society. . . An antiracist idea is any idea that suggests the racial groups are equals in all their apparent differences – that there is nothing right or wrong with any racial group. Antiracist ideas argue that racist policies are the cause of racial inequities.
Racist vs. Anti-racist Policies
A racist policy is any measure that produces or sustains racial inequity between racial groups. An antiracist policy is any measure that produces or sustains racial equity between racial groups. . . There is no such thing as a nonracist or race-neutral policy. Every policy in every institution in every community in every nation is producing or sustaining either racial inequity or equity between racial groups.
For additional race-equity concepts and definitions, please visit the Racial Equity Tools glossary webpage.
Overview
We all benefit from funding for education, health care, infrastructure, and other vital services regardless of race, gender, or income level. But the wealthy few have used an army of lobbyists and complicit lawmakers to drive down their own tax rates and to rig the rules. This has created regressive state tax systems that too often exacerbate income inequality across both race and income.[i] In “Progressive Wealth Taxation,” UC Berkeley economists Emmanuel Saez and Gabriel Zucman explained that the top marginal federal income tax rate dropped from more than 70% between 1936 and 1980 to only 37% since 2018, and “when combining all taxes at all levels of government, the U.S. tax system now resembles a giant flat tax.”[ii]
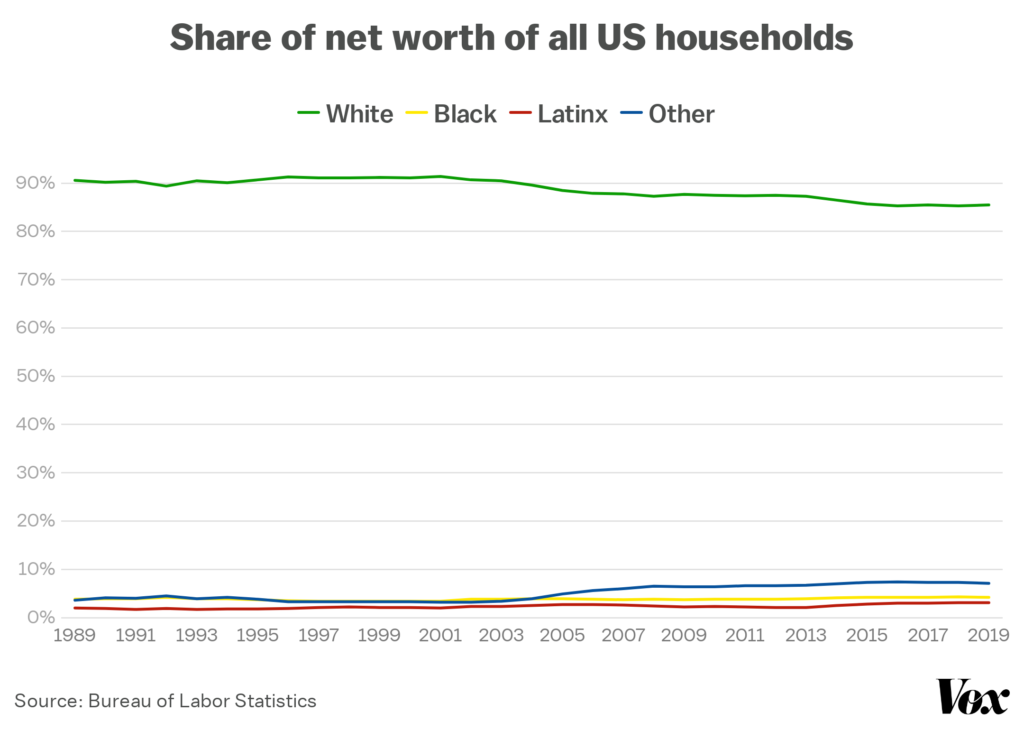
Flat taxes, and even worse, tax codes that levy higher taxes on low- and middle-income families, worsen income inequality and widen the racial wealth gap. Tax structures in 45 states exacerbate income inequality—in the 10 most regressive states, families at the bottom 20% of the income distribution pay up to six times as much in taxes as the state’s wealthiest families.[iii] While the investments made possible by taxes are a powerful force in combating racial inequities, the way those taxes are collected, and from whom, remains deeply inequitable. Regressive state tax policies have deep and lasting roots in anti-Blackness,[iv] and in tandem with discriminatory and exploitative policies that embedded racism across all social and economic systems (e.g., in ownership of land and access to housing, education, and credit[v]), state tax policies have not meaningfully addressed the growing racial wealth gap; and in many states, especially in the South,[vi] these policies actually make racial disparities worse. As of 2016, Black and Latinx families had a median net worth of $17,600 and $20,700, respectively, compared to $171,000 for white families.[vii] A recent study concluded that “if you belong to a historically marginalized racial or ethnic group, your racial status is the stronger predictor of your economic position than your education, income, and in this case, employment status and position.”[viii]
Strong communities and thriving families are built upon a foundation of public investments that benefit us all. Investments in good schools, affordable health care, and transportation infrastructure pay off for everyone. Research shows that higher levels of income inequality create a drag on economic and state tax revenue growth.[ix] States with fairer tax codes enjoy faster economic growth, faster income growth, and increased employment levels than states that are reliant on regressive taxes like sales and excise taxes.[x]
Under a lopsided tax code, a state’s poorest families are paying the most in taxes, while also bearing the brunt of disinvestment when tax revenues decline. During the Great Recession, states slashed education and health care budgets in the face of revenue shortfalls, with lasting consequences for low-income Black, brown, and white communities.[xi] Years of public disinvestment have left the same communities less prepared to weather the COVID-19 public health crisis and future economic downturns. For example, many states have used budget surpluses to push for “shortsighted, costly, permanent tax cuts,”[xii] which leaves these communities more vulnerable to future budget cuts,[xiii] especially as states again grapple with the risk of budget shortfalls.[xiv]
It doesn’t need to be this way; together we can rewrite tax codes to benefit us all. We’ve done this before, so we know that progressive revenue can stimulate economic growth, reduce income inequality, and narrow the gaps in income and wealth created through centuries of racism and discrimination.
Policy Considerations
Policymakers have the power to generate needed revenue by revamping their existing state’s tax codes. They can implement innovative approaches that build a more equitable future and center the needs of communities of color and low-income communities. When considering ways to promote racial equity and reduce wealth inequality in state tax systems, state legislators should refer to the following policy options and work with national and local advocates, especially those groups that center race equity, to develop the best policies for their state.
The wealthy use a range of tax avoidance strategies,[xv] including characterizing income from labor as business income, with pass-through business income in the form of long-term capital gains or dividends, all of which are taxed at a lower rate than ordinary personal income. The wealthy can also defer realizing capital gains and their inheritors can avoid taxes on these gains after they die. As explained by USC professor and tax law expert Edward J. McCaffery in his law journal article “The Death of the Income Tax,” the current tax code is really a wage tax, not an income tax, and those in the 1% of net wealth do not rely on their wages but instead use their assets as collateral to borrow tax-free.[xvi] The uber-wealthy are able to avoid income taxes and create generational wealth by relying on wealth instead of income through a process that McCaffery refers to as “buy, borrow, die.”[xvii] Therefore, we start with one of the most impactful progressive revenue reform ideas to address these loopholes: the wealth tax.

WEALTH TAX
Wealth taxes apply to either an individual’s net worth (total assets net of all debts) or some targeted asset class, which could include financial assets such as bank accounts, bonds, stocks, and/or non-financial assets such as real estate, yachts, sports cars, or other luxury goods. A wealth tax on a household above an exemption threshold is a critical tool for capturing revenue from the most affluent members of society who possess substantial wealth but may have comparatively lower incomes.
It is possible for the wealthiest households to have low taxable income because our tax codes have been designed to allow them to escape taxation in different ways. For example, the tax code does not address unrealized capital gains since until these assets are sold, they are not “taxable income” and thus, much of one’s wealth would not appear on their annual tax returns. (See Center on Budget and Policy Priorities’ report on the issue of special tax breaks for the wealthy for more information.)[xviii]
Estimates from UC-Berkeley professors Saez and Zucman indicated that a federal tax of 2% on net wealth above $50 million and 3% on net worth over $1 billion would only impact 0.1% of (or 75,000) American households and raise $2.75 trillion over a 10-year period.[xix]
Examples of Wealth Tax Legislation
- California took the lead by introducing a first-of-its-kind state wealth tax (2020 CA AB 2088) that would have applied a 0.4% rate to net worth, excluding real estate, in excess of $30 million per household.
- New York legislation (2020 NY SB 8277) would have created a billionaire “mark-to-market” tax[xx] on residents with $1 billion or more in net assets that would treat billionaires’ unrealized capital gains as income. It would have directed revenues from such a tax into a worker bailout fund to assist workers traditionally excluded from employment protection programs by providing them access to unemployment benefits. A similar but simpler version of this bill was later introduced (2021 NY SB 4482/AB 5092) without the worker bailout fund and with some additional changes, and this bill was estimated by advocates to have the potential to raise $23 billion in the first year and $1.3 billion per year thereafter.[xxi]
- Washington legislation (2021 WA HB 1406) would have assessed a modest 1% tax on “financial intangible assets, such as publicly traded options, futures contracts, and stocks and bonds” on wealth in excess of $1 billion (i.e., the first $1 billion is exempt from the wealth tax).
Wealth Tax Design
| An OECD study of European wealth taxes includes the following policy recommendations:[xxii] Low tax rates, especially if the net wealth tax comes on top of capital income taxes;Progressive tax rates;Limited tax exemptions and reliefs;An exemption for business assets, with clear criteria restricting the availability of the exemption (ensuring that real business activity is taking place and that assets are directly being used in the taxpayer’s professional activity);An exemption for personal and household effects up to a certain value;Determining the tax base based on asset market values, although the tax base could amount to a fixed percentage of that market value (e.g., 80%-85%) to prevent valuation disputes and take into account costs that may be incurred to hold or maintain the assets;Keeping the value of hard-to-value assets or the value of taxpayers’ total net wealth constant for a few years to avoid yearly reassessments;Allowing debts to be deductible only if they have been incurred to acquire taxable assets—or, if the tax exemption threshold is high, consider further limiting debt deductibility;Measures allowing payments in installments for taxpayers facing liquidity constraints;Ensuring transparency in the treatment of assets held in trusts;Continued efforts to enhance tax transparency and exchange information on the assets that residents hold in other jurisdictions;Developing third-party reporting;Establishing rules to prevent international double wealth taxation; andRegularly evaluating the effects of the wealth tax. |
ESTATE TAX
Another way states can tax wealth is through an estate tax, which is levied on the estate (money and property) of the most affluent individuals who have passed away. While there is a federal estate tax[xxiii] on estates valued over $12 million (as of 2022), only 12 states and the District of Columbia have their own estate tax.[xxiv] More states have considered implementing this extremely progressive tax because it helps to prevent the growth of “dynastic wealth” by directly targeting the intergenerational transfer of wealth and addressing the racial wealth gap. In 2016, 9 out of 10 households with assets above the federal estate tax threshold of $5.5 million were white.[xxv]
Examples of Estate Tax Legislation
- Washington has a 20% estate tax (WA Stat. § 83.100.040), which is one of the highest rates in the nation, and Washington is the only state without an income tax that levies an estate tax.
- The Hawaii legislature (2019 SB 1361) also increased its top estate tax rate to 20%, which became effective at the start of 2020. For estates over $10 million, the tax is now $1,385,000 plus 20% of the amount the net taxable estate exceeds $10 million.
- Maine (2019 ME LD 420/HP 329) legislators introduced a bill that would have increased their state’s estate tax by lowering the exclusion amount for an inheritance from $5.6 million to $2 million.
INHERITANCE TAX
While an estate tax is a levy on one’s estate, an inheritance tax is levied on those who inherit money or property of a person who has died. Inheritances are a major contributor to growing wealth inequality and disparities between white households and households of color. One reason white families hold more wealth is they are considerably more likely to receive an inheritance, a gift, or additional family support.[xxvi] Specifically, nearly 30% of white families report having received an inheritance or gift, compared to about 10% of Black families, 7% of Hispanic families, and 18% of other families. More robust taxation of inherited wealth not only reduces the transfer of concentrated wealth from one generation to the next, but it also serves as a progressive source of revenue for critical services that we all depend on.
Examples of Inheritance Tax Laws
Only six states impose inheritance taxes. Of these states, Nebraska (NE Stat. 77.2004, 77.2005, and 77.2006) has the highest top rate at 18% as of 2022. The state’s inheritance tax is imposed on all property inherited from the estate of the deceased. The value of such property is based on the fair market value as of the date of death, and the amount of the tax depends upon the recipient's relationship to the deceased. The surviving spouse pays no inheritance tax, children and other close relatives pay a 1% tax beyond an exemption amount, and more distant relatives pay a maximum 13% tax. In all other cases, the rate of tax is 18% on the clear market value of the beneficial interests in excess of $10,000. Unfortunately, recently enacted legislation (2022 NE LB 310) will reduce many of these rates and/or raise the exemption amounts starting in 2023.
The following states also levy a tax on inheritance. See below for details on their tax rates:
- Iowa (IA Code § 450.10) – recently enacted 2021 IA SF 619 will phase out this tax by 2025
- Kentucky (KY Stat. § 140.070)
- Maryland (MD Code § 7.204)
- New Jersey (NJ Stat. § 54.34.2)
- Pennsylvania (1971 PA Act 2 § 2116)
PROGRESSIVE INCOME TAX
When the political realities do not allow for a wealth tax of some kind, an incremental step toward reducing the racial wealth gap is to design state personal income tax systems to better ensure that the wealthiest pay their fair share. As of 2021, nine states do not even have a broad-based state income tax,[xxvii] many of which heavily rely on sales and excise taxes, a practice that the Institute on Taxation and Economic Policy (ITEP) deemed a characteristic of the most regressive state tax systems.[xxviii] States such as California, Minnesota, New Jersey, and Vermont have highly progressive income tax brackets and graduated-rate tax structures that allow them to tax different income at different rates.[xxix] In addition, at least eight states (CA, CT, HI, MD, MN, NJ, NY, and OR) and D.C. have enacted long-lasting millionaires’ taxes since 2000.[xxx] A 2022 ballot initiative in Massachusetts would raise the income tax rate for incomes above $1 million from 5% to 9%.[xxxi]
Examples of Progressive Income Tax Legislation & Ballot Initiatives
The graduated income tax structure ensures the most affluent individuals, who are mostly white,[xxxii] pay a greater percentage of their income in taxes than their lower- and middle-income counterparts.
- The New Jersey legislature passed 2020 NJ AB 10/Chapter 94, which increased the gross income tax rate from 8.97% to 10.75% on income between $1,000,000 and $5,000,000 (this was already the rate for income over $5 million), and provided an annual rebate of as much as $500 for families making less than $150,000.
- There are nine states, including Illinois, that impose a flat income tax.[xxxiii] In 2020, Illinois voters failed to pass a ballot initiative regarding a graduated income tax amendment,[xxxiv] which would have raised approximately $1.4 billion for the rest of the budget year and $3.4 billion over a full 12 months.[xxxv] The amendment would have repealed the state’s constitutional requirement that the personal income tax be a flat rate and instead allow for a graduated income tax.
- Arizona voters approved a 2020 ballot initiative, Proposition 208, to enact a 3.5% income tax, in addition to the existing income tax (4.5% in 2020), on income above $250,000 (single filing) or $500,000 (joint filing).[xxxvi] This initiative was successfully challenged in court by a right-wing advocacy group with ties to the Koch Family and subsequently overturned based on an interpretation of the state constitution. If the new law had survived court challenges, it would have provided additional tax revenue to support teacher and classroom support staff salaries, teacher mentoring and retention programs, and career and technical education programs.
Millionaire Migration/Tax Flight Myth
| This myth refers to the idea that taxing the wealthiest individuals will encourage them to leave and migrate to other states with lower taxes. Anti-tax advocates and politicians often use this myth to advocate for more tax cuts and regressive tax systems. However, the people who tend to move most frequently are not the rich, but instead are typically young college graduates and the lowest income residents who earn below-market incomes and want a better quality of life.[xxxvii] While a very small number of wealthy households may leave as a result of tax increases, migration rates for higher-income earners are low and have little effect on the millionaire tax base.[xxxviii] Research has shown that increasing tax rates on affluent households results in a net positive fiscal impact over time.[xxxix] |
CAPITAL GAINS TAX
States should also consider strengthening their taxes on capital gains income—the profits an investor realizes when selling an asset that has grown in value, such as shares of stock, mutual funds, or real estate investments. The Brookings Institution has a resource on capital gains reforms that discusses the current state of capital gains taxes on a federal level and different ways policymakers can use such taxes as a progressive source of revenue.[xl]
While some states levy a tax on personal income and capital gains at the same rate, as of 2021, nine states provide the wealthiest households with special tax preferences for their capital gains by taxing long-term capital gains at a lower rate than ordinary income.[xli], [xlii] These special tax breaks and preferences prioritize investors’ capital gains income at the expense of the wages and salaries earned by working families and lower-income households of color.
Examples of Capital Gains Tax Legislation
- In Vermont, the legislature passed a bill (2019 VT HB 541) that limits the amount of long-term capital gains a taxpayer can exclude from taxable income to $350,000. Prior to the bill’s passing, Vermont had historically allowed income taxpayers to exclude up to 40% of their capital gains from their taxable income, regardless of the total amount.[xliii]
- Similarly, the New Mexico legislature (2019 NM HB 6 - Section 14) enacted a tax and budget plan that scaled back a tax break for the wealthiest New Mexicans by reducing the portion of capital gains that are exempt from taxation from 50% to 40%. While the 10% deduction is a step in the right direction, the 40% exemption still serves as a large and unnecessary tax break to the highest-income earners—the individuals who already pay the smallest share of their income in state and local taxes. Thus, it is more equitable for states to not just scale back, but eliminate preferences for capital gains income.
- Not only will repealing tax preferences increase revenue for critical public services, but so will creating new surcharges on capital gains. Connecticut lawmakers (2019 CT HB 7415) considered a proposal to levy a 2% surcharge on the capital gains amassed by the wealthiest taxpayers with incomes over $500,000 (for individual filers) and $1 million (for married joint filers). Minnesota (2019 MN HF 2125) also introduced legislation that would have increased the state’s top marginal capital gains tax rate from 9.85% to 12.85%, the second-highest in the country after California (13.3%).
- In Washington, Governor Inslee proposed a capital gains tax on the sale of stocks, bonds, and other assets to increase the share of state taxes paid by Washington’s wealthiest taxpayers.[xliv] Legislation to implement this tax was enacted (2021 WA SB 5096), and the state will apply a 7% tax to capital gains earnings above $250,000 for individuals and $500,000 for joint filers.
- Legislation has been introduced to close the carried interest loophole. Legislation in Maryland (2021 MD SB 288/HB 215) would have imposed a 17% state income tax on the share general partners receive of a pass-through entity’s taxable income that is attributable to investment management services provided in the state. Similarly, bills in Oregon address the carried interest loophole: 2021 OR SB 479 and 2021 OR SB 482 would impose an additional 19.6% state tax on investment services partnership income, which is currently taxed at the lower net capital gains tax rate.
Note on the Carried Interest Loophole
| Investment funds—such as private equity and hedge funds—are often organized as partnerships. These partnerships typically have two types of partners: general partners and limited partners. General partners manage the fund, while limited partners typically only contribute capital to the partnership. General partners can receive two types of compensation: a management fee tied to a percentage of the fund’s assets and a profit share; or “carried interest,” tied to a percentage of the profits generated by the fund. In a common compensation agreement, general partners receive a management fee equal to 2% of the invested assets plus a 20% share in profits as carried interest. The management fee, less the fund’s expenses, is subject to ordinary federal and state income tax rates (the top federal income tax rate for individuals in 2020 is 37%) and the federal self-employment tax. However, taxation of the carried interest is deferred until profits are realized on the fund’s underlying assets, when at such time, the carried interest is taxed [the same] as investment income received by the limited partners. Thus, if the investment income consists solely of capital gains, the carried interest is taxed only when those gains are realized and at a lower capital gains rate on the federal level (the top capital gains tax rate in 2020 is 20%, plus a 3.8% net investment income tax). (Source: Fiscal and Policy Note for 2021 MD SB 288)[xlv] |

EXCESSIVE EXECUTIVE COMPENSATION TAX
In addition to a lack of progressive taxes, another contributing factor to the rise in income inequality is the excessive pay for chief executive officers (CEOs). Rather than raising the wages for their workers, corporations are increasing the wealth of their CEOs who make hundreds—sometimes thousands—of times more than their employees. Research has shown that excessive executive pay is not based on value of a CEO’s work and has a spillover effect that “helps pull up pay for privileged managers in the corporate and even nonprofit spheres.”[xlvi] Policymakers can work to address corporate greed and fight for wealth equity by closing the CEO-worker pay gap through an excessive executive compensation tax.
Examples of Excessive Executive Compensation Legislation
- The Portland, Oregon, City Council was the first in the country to enact a measure (2016 Ordinance 188129) that levies a tax on companies whose CEOs earned more than 100 times the median pay of their average workers. Corporate income tax increases by 10% if a company’s CEO has a salary ratio of above 100:1, and by 25% for companies with pay gaps equal to or exceeding 250:1. This tax generates revenue for the city’s general fund, which pays for essential city services.
- The Washington legislature (2019 WA HB 1681) introduced a bill that would have imposed a surcharge, in addition to business and occupation taxes and public utility taxes, on corporations with excessive chief executive officer pay. Similar to Portland, Oregon’s law, this legislation would have targeted companies with chief executives who were paid more than 50 times the pay of the average worker of that company. The legislature also introduced a second bill (2019 WA SB 6017) that would have imposed an excise tax on annual compensation in excess of $1 million, with a tax rate between 5% and 10% depending on the compensation amount.
- Other lawmakers in California, Connecticut, Illinois, Massachusetts, Minnesota, New York, and Rhode Island have also introduced similar bills. The Institute for Policy Studies has an online guide that includes a list of federal, state, and local legislative proposals related to CEO-worker pay ratios, along with general resources.[xlvii]
RAISING PROGRESSIVE MUNICIPAL REVENUE
While legislatures have the power to reform their state’s tax codes, they also have the ability to increase municipal revenue through progressive strategies. However, there are states that limit municipal powers from implementing progressive taxation structures. For example, some states have statutory and constitutional limits on the amount of property taxes that can be levied at the local level.[xlviii] As property tax revenues often support locally provided public services and amenities, state limitations on such taxes prohibit local governments from fully investing in such services. As a result, municipalities are forced to reckon with deep spending cuts, resulting in severe consequences for and decreasing the quality of life of their residents.
Income inequality is an issue that significantly affects communities on not only a national and state level, but on a local and regional scale as well. In order to effectively address disparities in wealth, state policymakers can consider legislation to promote progressive tax structures within municipalities, including repealing any state preemption of local revenue-raising authority. (See Local Progress’s 2015 report for more information about the major obstacles of raising municipal revenue, along with policy recommendations for cities, regions, and states to make local tax collections more progressive.)[xlix]

Public Opinion Polling
The following sample of public opinion polls over the last few years demonstrates a strong support nationally and in sampled states for increasing taxes on the rich, including through a wealth tax, and for protecting key public programs.
NATIONAL POLLS
60% of Americans say billionaires don’t pay the full amount they owe in taxes - YouGov poll [l]
- Most Americans say billionaires in the U.S. generally don’t pay the full amount of taxes they owe, including 60% of Independents and 53% of those with incomes higher than 200% of the median
- Nearly two-thirds of Americans support requiring households to pay at least 20% of their income over $100 million in taxes, including half of Republicans and 64% of those with income greater than 200% of the median
The Need for a True Wealth Tax to Support Those Most in Need Due to the Coronavirus - Data for Progress and the Justice Collaborative Institute [li]
- Voters support a wealth tax on the richest 5% of Americans. 66% of voters support a one-time, 5% wealth tax on the richest 5%. 60% of voters agree that essential workers are doing their fair share, and that wealthy Americans must do the same with a wealth tax.
Economy Poll - Reuters/Ipsos [lii]
- Voters support a wealth tax on the richest Americans. 64% of voters agree that the very rich should contribute an extra share of their total wealth each year to support public programs. Only 33% of voters believe that the very rich should be allowed to keep wealth that increases inequality.
January Tracker Poll - GSG, GBAO, and Navigator [liii]
- Voters oppose cuts to public programs. 62% of voters oppose scaling back programs like Social Security and food stamps to reduce the national debt.
- Voters support raising taxes on the wealthiest Americans. 64% of voters support raising taxes significantly on the top 1% of Americans.
Voters Support the Thrive Agenda - Data for Progress [liv]
- Voters support strong public investments. 66% of voters support reinvesting in public institutions that serve all Americans.
Voters in Key States Support a Wealth Tax - Data for Progress [lv]
- Voters support increasing taxes on the wealthy, and express even stronger support for wealth taxes as a means to fund infrastructure investments. 56% of voters support the creation of a 2% wealth tax on those with a net worth of over $50 million. When framed as a funding mechanism for infrastructure investments, 74% of voters support a wealth tax, 65% support a surtax on income over $200,000, and 63% support a real corporate profits tax.
Small Businesses Support Raising Taxes on the Wealthy - Businesses for Responsible Tax Reform [lvi]
- 64% of small business owners support increasing taxes on the wealthy.
ALG Research for Tax March/ATF [lvii]
- 75% of voters support raising taxes on the rich. Voters also ranked “making the rich pay their fair share in taxes” as their third-highest priority, after health care affordability and protecting Medicare and Social Security from budget cuts.
- 68% of voters support raising taxes on multimillionaires by taxing income in excess of $10 million at a 70% rate.
- 62% of voters support a wealth tax on income over $1 million.
New York Times/SurveyMonkey [lix]
- 67% of voters support raising taxes on Americans making $400,000 or more and keeping tax rates at current levels for those earning less than $400,000.
Financial Times/Peterson Foundation [lx]
- 89% of voters support reducing the deficit by closing tax loopholes.
- 80% of voters support raising taxes on higher-income earners.
STATE POLLS
Massachusetts - WBUR (May 2018) [lxi]
- 77% of voters support a millionaire’s tax to levy a 4% surtax on income in excess of $1 million.
- 67% of voters support a reduction in the regressive sales tax, from 6.25% to 5%.
New Jersey - Rutgers/Eagleton/FDU (April 2019) [lxii]
- 72% of voters support raising taxes on households making more than $1 million annually.
Illinois - Paul Simon Public Policy Institute at Southern Illinois University (Spring 2020) [lxiii]
- 68% of voters support a millionaire’s tax to levy a 3% surcharge on annual incomes of $1 million or more.
- 65% of voters support a graduated income tax structure.
New York - Hart Research (January 2020) [lxiv]
- 93% of voters support a new tax on luxury homes and apartments that are not a family’s primary residence and worth more than $5 million.
- 92% of voters support a billionaire’s tax, including 66% in strong support, to apply a 2% tax on wealth in excess of $1 billion.
- 90% of voters support raising the state income tax rate on income over $5 million per year.
- 87% of voters believe that billionaires, and 81% believe that those with incomes over $5 million, should pay more in state and local taxes.
- Voters overwhelmingly support increased taxes on the wealthy to address the state’s budget shortfall, while strongly rejecting cuts to essential services. To address the state’s budget shortfall:
- 91% of voters support raising taxes on billionaires.
- 90% of voters support raising taxes on incomes greater than $5 million.
- 66% of voters oppose reducing funding for state colleges and universities.
- 75% of voters oppose reducing funding for local cities and towns.
- 80% of voters oppose reducing funding for roads, bridges, and transportation.
- 81% of voters oppose reducing funding for K-12 education.
- 81% of voters oppose reducing funding for health care for low-income families and seniors.
- 85% of voters oppose reducing funding for services for the elderly or disabled.
- Voters understand that raising taxes on the wealthy is good for all of us. 64% of voters believe that increased wealth taxes will have a good impact on the economy. 62% of voters believe that it will have a good impact on public education, 61% of voters believe that it will have a good impact on public services, and 60% believe that it will have a good impact on access to health care and long-term care.
Arizona, Colorado, Georgia, Iowa, Kansas, Kentucky, Maine, Michigan, Mississippi, North Carolina, and Texas - Data for Progress (September 2020) [lxv]
- 61% of voters across 11 battleground states are more likely to vote for a candidate who supports a wealth tax. Support was even higher in Maine (69%), Iowa (69%), Arizona (64%), and North Carolina (62%).
- 62% of voters across 11 battleground states support a 2% wealth tax on individuals with a net worth of over $50 million. Support was even higher in Maine (68%), Colorado (68%), Kansas (65%), Michigan (64%), and Iowa (64%).
Wisconsin - Public Policy Polling (July 2019) [lxvi]
- 79% of voters support raising taxes on the wealthiest Americans.
- 71% of voters agree that the rich can afford to pay more in taxes, and 66% say that the rich do not currently pay their fair share. 54% of voters consider making the rich pay their fair share to be a very important issue.
- 80% of voters support raising taxes on households with over $10 million in wealth.
- 69% of voters agree that the rich take advantage of tax loopholes, leaving the rest of us to pick up the tab, even as they’ve gotten richer.
- 66% of voters support raising taxes on the rich to protect important government programs like Medicare, Medicaid, and Social Security.
Florida - Public Policy Polling (June 2019) [lxvii]
- 72% of voters support raising taxes on the richest 5% of Americans, including 58% in strong support.
- 62% of voters believe that the rich do not pay their fair share of taxes. 65% agree that the rich take advantage of many tax loopholes, leaving the rest of us to pick up the tab, even as they’ve gotten richer.
- 63% of voters support raising taxes on the rich to protect important government programs like Medicare, Medicaid, and Social Security.
- 70% of voters support raising taxes on households with over $10 million in wealth.
Additional Resources
- Academic Articles/Papers/Letters
- Disparate Recoveries: Wealth, Race, and the Working Class after the Great Recession, Fenaba R. Addo and William A. Darity, Jr., The ANNALS of the American Academy of Political and Social Science, https://journals.sagepub.com/doi/10.1177/00027162211028822
- Progressive Wealth Taxation, Emmanuel Saez and Gabriel Zucman, Brookings Papers on Economic Activity, https://www.brookings.edu/wp-content/uploads/2019/09/Saez-Zucman_conference-draft.pdf
- The California Tax on Extreme Wealth (ACA 8 & AB 310): Revenue, Economic, and Constitutional Analysis, Brian D. Galle, David Gamage, Emannual Saez, and Darien Shanske, Indiana Legal Studies Research Paper, https://papers.ssrn.com/sol3/papers.cfm?abstract_id=3924524
- The Death of the Income Tax (or, the Rise of America’s Universal Wage Tax), Edward J. McCaffery, Indiana Law Journal, https://papers.ssrn.com/sol3/papers.cfm?abstract_id=3242314
- Taxing the Rich: Issues and Options, Lily L. Batchelder and David Kamin, https://papers.ssrn.com/sol3/papers.cfm?abstract_id=3452274
- Millionaire Migration and Taxation of the Elite: Evidence from Administrative Data, Cristobal Young, Charles Varner, Ithai Z. Lurie, and Richared Prisinzano, American Sociological Review, http://cristobalyoung.com/development/wp-content/uploads/2018/11/Millionaire_migration_Jun16ASRFeature.pdf
- Americans for Tax Fairness (ATF)
- Fair Taxes Now: Revenue Options for a Fair Tax System, https://americansfortaxfairness.org/wp-content/uploads/ATF-Fair-Taxes-Now-Report-FINAL-FINAL-4-12-19.pdf
- Center on Budget and Policy Priorities (CBPP)
- Advancing Racial Equity With State Tax Policy, https://www.cbpp.org/research/state-budget-and-tax/advancing-racial-equity-with-state-tax-policy
- State Taxes on Capital Gains, https://www.cbpp.org/research/state-budget-and-tax/state-taxes-on-capital-gains
- State Limits on Property Taxes Hamstring Local Services and Should Be Relaxed or Repealed, https://www.cbpp.org/sites/default/files/atoms/files/7-18-18sfp.pdf
- Community Service Society
- How Tax Reforms Can Address Historic Inequality and Save Our State, https://smhttp-ssl-58547.nexcesscdn.net/nycss/images/uploads/pubs/Tax_report_new_V7.pdf
- Economic Policy Institute (EPI)
- Progressive Revenue Options, https://www.epi.org/publication/progressive-revenue-options/
- Institute on Taxation and Economic Policy (ITEP)
- Moving Toward More Equitable State Tax Systems, https://itep.org/moving-toward-more-equitable-state-tax-systems/
- Who Pays? A Distributional Analysis of the Tax Systems in All 50 States, https://itep.org/whopays/#_edn2
- Creating Racially and Economically Equitable Tax Policy in the South, https://itep.org/creating-racially-and-economically-equitable-tax-policy-in-the-south/
- Race, Wealth, and Taxes: How the Tax Cuts and Jobs Act Supercharges the Racial Wealth Divide (joint publication with Prosperity Now), https://prosperitynow.org/sites/default/files/resources/ITEP-Prosperity_Now-Race_Wealth_and_Taxes-FULL REPORT-FINAL_6.pdf
- Invest In Our NY Coalition
- Plan to Fund Our Future, https://www.investinourny.org/media/pages/home/c0f7f56781-1615110022/investinournewyorkact-policyreport.pdf
- Local Progress
- Progressive Policies for Raising Municipal Revenue, https://localprogress.org/wp-content/uploads/2013/09/Municipal-Revenue_CPD_040815.pdf
- National Association of Counties
- Doing More With Less: State Revenue Limitations and Mandates on County Finances, https://www.naco.org/resources/doing-more-less-state-revenue-limitations-and-mandates-county-finances
- OECD
- The Role and Design of Net Wealth Taxes in the OECD, https://www.oecd-ilibrary.org/taxation/the-role-and-design-of-net-wealth-taxes-in-the-oecd_9789264290303-en
- PolicyLink
- Building an Equitable Tax Code: A Primer for Advocates, https://www.policylink.org/resources-tools/building-an-equitable-tax-code
- Roosevelt Institute
- Bolstering State Economies by Raising Progressive Taxes, https://rooseveltinstitute.org/wp-content/uploads/2020/07/RI_BolsteringStateEconomies_IssueBrief_072020.pdf
Endnotes
[i] Wiehe, M., Davis, A., Davis, C., Gardner, M., Christensen Gee, L., & Grundman, D. (2018). Who Pays? A Distributional Analysis of the Tax Systems in All 50 States. Institute on Taxation and Economic Policy. https://itep.sfo2.digitaloceanspaces.com/whopays-ITEP-2018.pdf
[ii] Saez, E., & Zucman, G. (2019). Progressive Wealth Taxation. Brookings Papers on Economic Activity, Fall 2019. https://www.brookings.edu/wp-content/uploads/2020/10/Saez-Zuchman-final-draft.pdf
[iii] Wiehe, et al. (2018). Who Pays?
[iv] Leachman, M., Mitchell, M., Johnson, N., & Williams, E. (2018). Advancing Racial Equity With State Tax Policy. Center on Budget and Policies Priorities. https://www.cbpp.org/research/state-budget-and-tax/advancing-racial-equity-with-state-tax-policy
[v] Kent, A. H., Lanier, N., Perkis, D.F., & James, C. (2022). Examining Racial Wealth Inequality. Federal Reserve Bank of St. Louis. https://research.stlouisfed.org/publications/page1-econ/2022/03/01/examining-racial-wealth-inequality
[vi] Das, K. (2022). Creating Racially and Economically Equitable Tax Policy in the South. Institute on Taxation and Economic Policy. https://itep.org/creating-racially-and-economically-equitable-tax-policy-in-the-south/
[vii] Dettling, L. J., Hsu, J. W., Jacobs, L., Moore, K. B., Thompson, J. P., & Llanes, E. (2017). Recent Trends in Wealth-Holding by Race and Ethnicity: Evidence from the Survey of Consumer Finances. Board of Governors of the Federal Reserve System. https://doi.org/10.17016/2380-7172.2083
[viii] Addo, F. R., & Darity, W. A. (2021). Disparate Recoveries: Wealth, Race, and the Working Class after the Great Recession. The Annals of the American Academy of Political and Social Science. https://doi.org/10.1177/00027162211028822
[ix] Petek, G. J., Bovino, B. A., & Panday, S. (2014). Income Inequality Weighs On State Tax Revenues. Standard & Poor's Ratings Services. https://s3.documentcloud.org/documents/1301747/s-amp-p-income-inequality-weighs-on-state-tax.pdf
[x] Davis, C., & Buffie, N. (2017). Trickle-Down Dries Up: States without personal income taxes lag behind states with the highest top tax rates. Institute on Taxation and Economic Policy. https://itep.sfo2.digitaloceanspaces.com/trickledowndriesup_1017.pdf
[xi] Johnson, N., Oliff, P., & Williams, E. (2011). An Update on State Budget Cuts: At Least 46 States Have Imposed Cuts That Hurt Vulnerable Residents and the Economy. Center on Budget and Policies Priorities. https://www.cbpp.org/research/an-update-on-state-budget-cuts
[xii] Institute on Taxation and Economic Policy. (2022). State Tax Watch. https://itep.org/state-tax-watch/
[xiii] Auxier, R.C. (2022). How Post-Pandemic Tax Cuts Can Affect Racial Equity: An Examination of How State Tax Changes Affected Different Income Groups and Representative Households in Arizona, Maryland, New Mexico, and Ohio. Urban Institute. https://www.urban.org/sites/default/files/publication/105447/how-post-pandemic-tax-cuts-can-affect-racial-equity_1.pdf
[xiv] Dadayan, L. (2022). States Forecast Weaker Revenue Growth Ahead of Growing Uncertainties. Tax Policy Center. https://www.taxpolicycenter.org/taxvox/states-forecast-weaker-revenue-growth-ahead-growing-uncertainties
[xv] Batchelder, L. L., & Kamin, D. (2019). Taxing the Rich: Issues and Options. SSRN. http://dx.doi.org/10.2139/ssrn.3452274
[xvi] McCaffery, E. J. (2019). The Death of the Income Tax (or, the Rise of America's Universal Wage Tax). USC Law Legal Studies Paper No. 18-26. http://dx.doi.org/10.2139/ssrn.3242314
[xvii] Ibid.
[xviii] Marr, C., Jacoby, S., & Bryant, K. (2019). Substantial Income of Wealthy Households Escapes Annual Taxation Or Enjoys Special Tax Breaks. Center on Budget and Policy Priorities. https://www.cbpp.org/research/federal-tax/substantial-income-of-wealthy-households-escapes-annual-taxation-or-enjoys
[xix] Saez, E., & Zucman, G. (January 18, 2019). [Letter to U.S. Sen. Elizabeth Warren on impact of proposed wealth tax]. Retrieved from https://www.warren.senate.gov/imo/media/doc/saez-zucman-wealthtax.pdf
[xx] Leiserson, G., & McGrew, W. (2019). Taxing wealth by taxing investment income: An introduction to mark-to-market taxation. Washington Center for Equitable Growth. https://equitablegrowth.org/taxing-wealth-by-taxing-investment-income-an-introduction-to-mark-to-market-taxation/
[xxi] Invest In Our New York, (2021). Invest In Our New York Act [Fact sheet]. https://www.investinourny.org/media/pages/home/1f8653f0b6-1614711481/ionyactsummary_outlines_updatedmar02-2021.pdf
[xxii] OECD. (2018). The Role and Design of Net Wealth Taxes in the OECD. OECD Tax Policy Studies, 26. https://doi.org/10.1787/9789264290303-en
[xxiii] Tax Policy Center. (2020). Key Elements of the U.S. Tax System: How do the estate, gift, and generation-skipping transfer taxes work? The Tax Policy Center’s Briefing Book. https://www.taxpolicycenter.org/briefing-book/how-do-estate-gift-and-generation-skipping-transfer-taxes-work
[xxiv] Urban Institute. (n.d.). State and Local Backgrounders: Estate and Inheritance Taxes. Retrieved July 5, 2022, from https://www.urban.org/policy-centers/cross-center-initiatives/state-and-local-finance-initiative/state-and-local-backgrounders/estate-and-inheritance-taxes
[xxv] Maxwell, C., & Solomon, D. (2017). 4 Ways Repealing the Estate Tax Would Expand the Racial Wealth Gap. Center for American Progress. https://www.americanprogress.org/article/4-ways-repealing-estate-tax-expand-racial-wealth-gap/
[xxvi] Bhutta, N., Chang, A. C., Dettling, L. J., & Hsu, J. (2020). Disparities in Wealth by Race and Ethnicity in the 2019 Survey of Consumer Finances. Board of Governors of the Federal Reserve System. https://doi.org/10.17016/2380-7172.2797
[xxvii] Wiehe, et al. (2018). Who Pays?
[xxviii] Ibid.
[xxix] Ibid.
[xxx] Tharpe, W. (2019). Raising State Income Tax Rates at the Top a Sensible Way to Fund Key Investments. Center on Budget and Policy Priorities. https://www.cbpp.org/research/state-budget-and-tax/raising-state-income-tax-rates-at-the-top-a-sensible-way-to-fund-key
[xxxi] Ballotpedia. (n.d.). Massachusetts Tax on Income Above $1 Million for Education and Transportation Amendment (2022). Retrieved July 5, 2022, from https://ballotpedia.org/Massachusetts_Tax_on_Income_Above_$1_Million_for_Education_and_Transportation_Amendment_(2022)
[xxxii] USAFacts. (2020). White people own 86% of wealth and make up 60% of the population. Retrieved July 5, 2022, from https://usafacts.org/articles/white-people-own-86-wealth-despite-making-60-population/
[xxxiii] Institute on Taxation and Economic Policy. (2019). How Does Your State Tax Income? https://itep.org/personal-income-tax-rate-structure-by-state/
[xxxiv] Ballotpedia. (n.d.). Illinois Allow for Graduated Income Tax Amendment (2020). Retrieved July 5, 2022, from https://ballotpedia.org/Illinois_Allow_for_Graduated_Income_Tax_Amendment_(2020)
[xxxv] Sturm, V. (2020). Gov. J.B. Pritzker’s graduated-rate income tax: Here’s what you need to know. Chicago Tribune. https://www.chicagotribune.com/politics/ct-cb-illinois-pritzker-graduated-income-tax-20200820-g3lrqjqp2ne7rkjxkjammf2ub4-story.html
[xxxvi] Ballotpedia. (n.d.). Arizona Proposition 208, Tax on Incomes Exceeding $250,000 for Teacher Salaries and Schools Initiative (2020). Retrieved July 5, 2022, from https://ballotpedia.org/Arizona_Proposition_208,_Tax_on_Incomes_Exceeding_$250,000_for_Teacher_Salaries_and_Schools_Initiative_(2020)
[xxxvii] Institute on Taxation and Economic Policy. (2018). No Need for the MythBusters, the Millionaire Tax Flight Myth is Busted Again. https://itep.org/no-need-for-the-mythbusters-the-millionaire-tax-flight-myth-is-busted-again/
[xxxviii] Young, C., Varner, C., Lurie, I. Z., & Prisinzano, R. (2016). Millionaire Migration and Taxation of the Elite: Evidence from Administrative Data. American Sociological Review, 81(3) 421–446. http://cristobalyoung.com/development/wp-content/uploads/2018/11/Millionaire_migration_Jun16ASRFeature.pdf
[xxxix] Tannenwald, R., Shure, J., & Johnson, N. (2011). Tax Flight Is a Myth. Center on Budget and Policy Priorities. https://www.cbpp.org/research/state-budget-and-tax/tax-flight-is-a-myth
[xl] Enda, G., & Gale, W. G. (2020). How could changing capital gains taxes raise more revenue? Brookings Institution. https://www.brookings.edu/blog/up-front/2020/01/14/how-could-changing-capital-gains-taxes-raise-more-revenue/
[xli] McNichol, E. (2021). State Taxes on Capital Gains. Center on Budget and Policy Priorities. https://www.cbpp.org/research/state-budget-and-tax/state-taxes-on-capital-gains
[xlii] Grundman O’Neill, D., & Wiehe, M. (2016). The Folly of State Capital Gains Tax Cuts. Institute on Taxation and Economic Policy. https://itep.org/the-folly-of-state-capital-gains-tax-cuts-1/
[xliii] Campbell, G. (2019). Fiscal Note on H.541: An act relating to changes that affect the revenue of the State- Committee of Conference. Vermont Legislative Joint Fiscal Office. https://ljfo.vermont.gov/assets/Publications/House-Bills/7bb5bb90ee/GENERAL-340238-v5-Final_Revenue_Bill_Fiscal_Note.pdf
[xliv] WA Dept. of Revenue. (2021). Capital gains tax Q&A (2019-21 proposal). Office of Financial Management. https://ofm.wa.gov/budget/state-budgets/gov-inslees-proposed-2019-21-budgets/proposed-2019-21-budget-and-policy-highlights/revenue-changes/capital-gains-tax-qa
[xlv] Rehrmann, R. J. (2021). Fiscal and Policy Note for Senate Bill 288. MD Dept. of Legislative Services. https://mgaleg.maryland.gov/2021RS/fnotes/bil_0008/sb0288.pdf
[xlvi] Baker, D., Bivens, J., & Schieder, J. (2019). Reining in CEO compensation and curbing the rise of inequality. Economic Policy Institute. https://www.epi.org/publication/reining-in-ceo-compensation-and-curbing-the-rise-of-inequality/
[xlvii] Institute for Policy Studies. (n.d.). CEO-Worker Pay Resource Guide. Retrieved July 25, 2022, from https://inequality.org/action/corporate-pay-equity/
[xlviii] Lav, I. J., & Leachman, M. (2018). State Limits on Property Taxes Hamstring Local Services and Should Be Relaxed or Repealed. Center on Budget and Policy Priorities. https://www.cbpp.org/research/state-budget-and-tax/state-limits-on-property-taxes-hamstring-local-services-and-should-be
[xlix] Sebastian, S., & Kumodzi, K. (2015). Progressive Policies for Raising Municipal Revenue. Local Progress and The Center for Popular Democracy. https://localprogress.org/wp-content/uploads/2013/09/Municipal-Revenue_CPD_040815.pdf
[l] Orth, T. (2022). 60% of Americans say billionaires don’t pay the full amount they owe in taxes. YouGov. https://today.yougov.com/topics/politics/articles-reports/2022/04/01/americans-say-billionaires-dont-pay-full-taxes
[li] Markovits, D. (2020). The Need for a True Wealth Tax to Support Those Most in Need Due to the Coronavirus. Data For Progress and The Justice Collaborative Institute. https://www.filesforprogress.org/memos/wealth-tax-coronavirus.pdf
[lii] Ipsos. (2020). A majority of Americans agree that the very rich should contribute an extra
share of their total wealth to support public programs [Press release]. https://www.ipsos.com/sites/default/files/ct/news/documents/2020-01/topline_reuters_economy_poll_pt_1_01_10_2020_0.pdf
[liii] Global Strategy Group & GBAO. (2020). Navigator January Tracker [Survey data]. https://navigatorresearch.org/wp-content/uploads/2020/01/Navigator-January-Tracker-Toplines-F01.24.20.pdf
[liv] Deiseroth, D., Mulholland, M., & NoiseCat, J. B. (2020). Voters Support the Thrive Agenda. Data For Progress. https://www.filesforprogress.org/memos/voters-support-thrive-agenda.pdf
[lv] Winter, E. (2020). Voters in Key States Support a Wealth Tax. Data For Progress and Roosevelt Forward. https://www.filesforprogress.org/memos/voters-in-key-states-support-a-wealth-tax.pdf
[lvi] Businesses for Responsible Tax Reform. (2019). POLL: Small Businesses Want to See Presidential Tax Returns, Support Raising Taxes on the Wealthy. https://docs.wixstatic.com/ugd/4a8609_130cf041386d48ae9409bc191bcf8cdb.pdf
[lvii] ALG Research. (2019). Online Nationwide Tax Poll [Survey data]. Americans for Tax Fairness. https://americansfortaxfairness.org/wp-content/uploads/Baseline-Nationwide-Tax-Online-Poll-March-15-20-2019.pdf
[lviii] Marist Institute for Public Opinion. (2019). NPR/PBS NewsHour/Marist Poll of 1,346 National Adults [Survey data]. http://maristpoll.marist.edu/wp-content/uploads/2019/07/NPR_PBS-NewsHour_Marist-Poll_USA-NOS-and-Tables_1907190926.pdf#page=3
[lix] Wronski, L. (2020). New York Times|SurveyMonkey poll: November 2020. https://www.surveymonkey.com/curiosity/nyt-november-2020-cci/
[lx] Peter G. Peterson Foundation. (2020). Majority of Voters Support Higher Taxes for Wealthy and Corporations — and Want Next President to Pay for His Priorities. https://www.pgpf.org/infographic/majority-of-voters-support-higher-taxes-for-wealthy-and-corporations-and-want-next-president-to-pay-for-his-priorities
[lxi] Brown, S. (2018). WBUR Poll: Ballot Questions On Sales Tax Rollback And 'Millionaire's Tax' Maintain High Support. WBUR. https://www.wbur.org/news/2018/05/31/sales-tax-millionaires-tax-ballot-poll
[lxii] Rutgers-Eagleton/FDU. (2019). Joint Rutgers-Eagleton/FDU Poll: New Jerseyans Support Millionaires Tax [Survey data]. https://eagletonpoll.rutgers.edu/wp-content/uploads/2020/04/release_04-04-19.pdf
[lxiii] Paul Simon Public Policy Institute. (2020). Simon Poll, Spring 2020 (statewide) [Survey data]. https://opensiuc.lib.siu.edu/cgi/viewcontent.cgi?article=1017&context=ppi_statepolls
[lxiv] Molyneux, G., & Garin, G. (2020). New Yorkers’ Support for New Taxes on Billionaires and
Ultra-Millionaires [Poll memo]. Hart Research Associates.
[lxv] Winter. (2020). Voters in Key States.
[lxvi] Williams, J. (2019). Wisconsin Voters Strongly Support Raising Taxes on the Rich [Poll memo]. Public Policy Polling. https://taxmarch.org/wp-content/uploads/2019/07/Wisconsin-Voters-Strongly-Support-Raising-Taxes-on-the-Rich.pdf
[lxvii] Williams, J. (2019). Florida Voters Strongly Support Raising Taxes on the Rich [Poll memo]. Public Policy Polling. https://taxmarch.org/wp-content/uploads/2019/06/Florida-Voters-Strongly-Support-Raising-Taxes-On-The-Rich.pdf